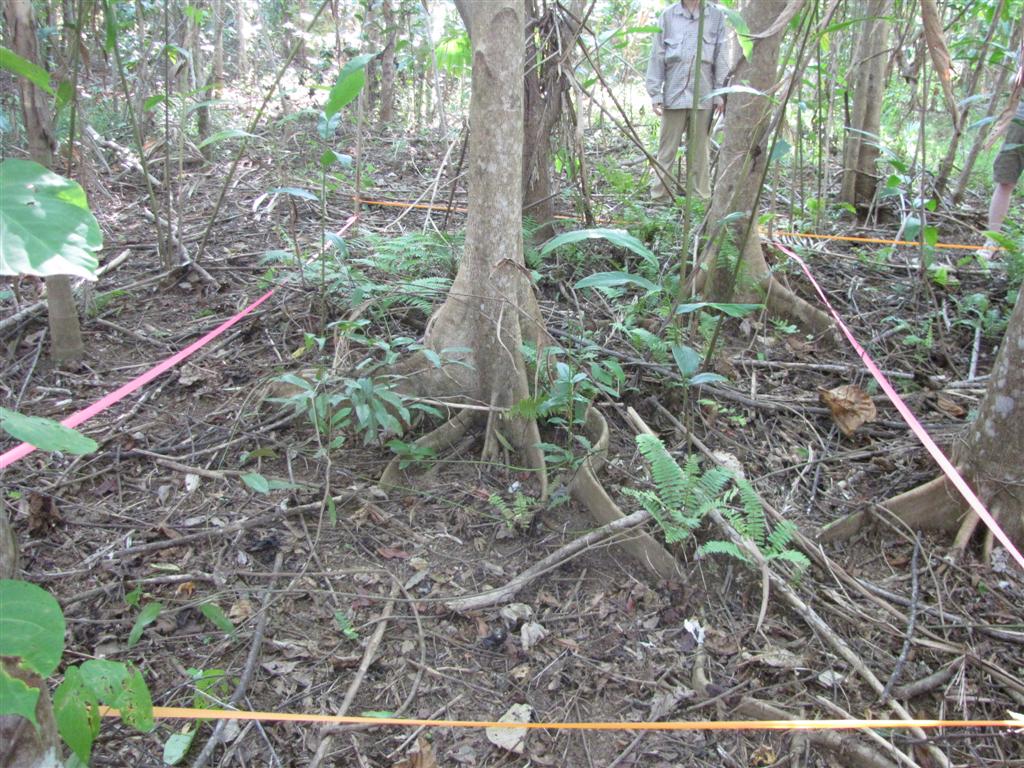
Three other students (Cory Baker, Tanya Bitcon, Elizabeth Eck) and I collected data about the regeneration process. Every 20 meters, in a straight line through the land Dr. Spencer reforested, we randomly selected a 4x4 meter plot, staked it out for measuring, and recorded information about the trees in each. We did this for 16 plots, extending approximately one kilometer from the first plot in 1992 to the most current plot of 2011. Although it is not exact, each plot represents about one year of growth. Each year, Dr. Spencer planted new vegetation roughly every 20 meters. Plot #1 is the first plot planted in 1992; Plot #16 is the last (most recent) plot planted in 2011.
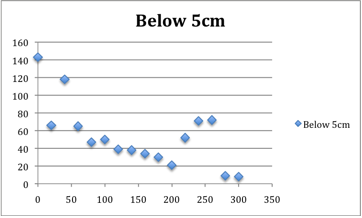
We focused on total number of trees, number of saplings/seedlings (young trees under 2 cm), and the circumference of each tree (categorized into three groups: Under 5 cm, Under 20 cm, and Under 100 cm). This gave us an estimate of the total growth of the area. The following is a summary of our findings. In the graphs and photo series it is easy to notice the gradual decline of vegetation, aside from a few outlier plots primarily due to cyclone damage. Graphs are courtesy of Tanya Bitcon. The x-axis is the number of meters along the regeneration trail, with 0 meters marking the beginning of the trail (vegetation planted in 1992) and 300 marking the end of the trail (vegetation planted in 2011). Pictures of each plot are courtesy of Tanya Bitcon and Elizabeth Eck.
 |
| Plot 1 |
 |
| Plot 2 |
 |
| Plot 3 |
 |
| Plot 4 |
 |
| Plot 5 |
 |
| Plot 6 |
 |
| Plot 7 |
 |
| Plot 8 |
 |
| Plot 9 |
 |
| Plot 10 |
 |
| Plot 11 |
 |
| Plot 12 |
 |
| Plot 13 |
 |
| Plot 14 |
 |
| Plot 15 |
 |
| Plot 16 |


No comments:
Post a Comment